| (a) A rectangle is imprecise |
|
|||
 |
  |
|
|
Sudheendra Vijayanarasimhan and Kristen Grauman
Department of Computer Sciences,
University of Texas at Austin
Recent work in object detection offers various ways to avoid sliding windows and improve localization efficiency. However, they assume that the object fits well inside rectangular or coarse polygonal regions. This is rather restrictive because
| (a) A rectangle is imprecise |
|
|||
|
|
|
|
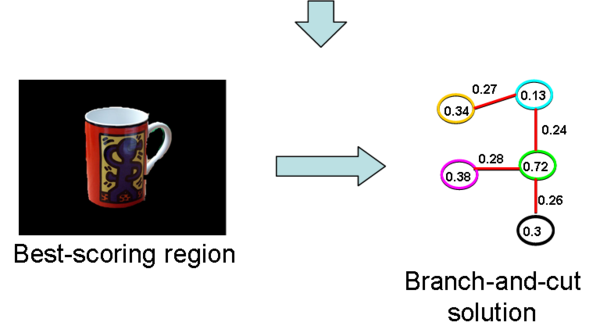
A region-based detector that sums classifier responses within connected subregions can more accurately detect non-boxy objects.
Our main contribution is to show how to obtain this best-scoring region efficiently.
Given a test image,
The goal is to identify the subset of connected regions (nodes) whose summed scores are maximal.
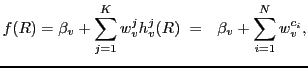
Using a linear kernel SVM applied to a bag-of-features representation the classifier response for a region can be rewritten as:
 |
(1) |
Thus, the score of a region is the sum of its ![]() features' word weights.
features' word weights.
For detection, the goal is to determine the region within a novel image ![]() that maximizes the score:
that maximizes the score:
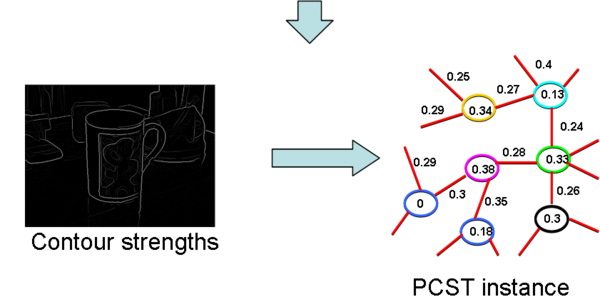
This search problem can be reduced to finding the maximum-weight connected subgraph problem (MWCS) as follows:
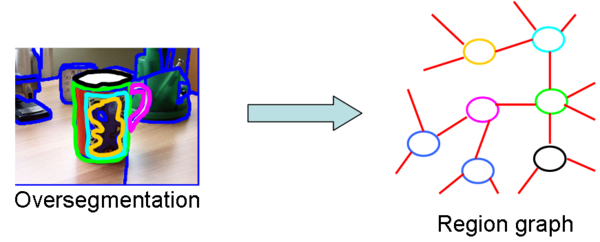
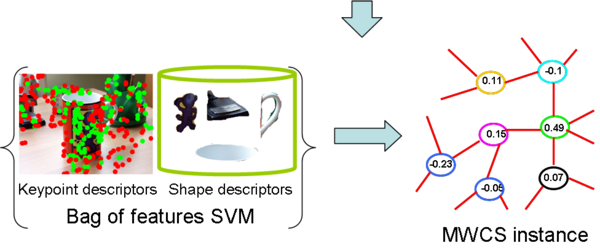
The objective is now to identify the maximum-weight connected subgraph in the region graph, defined as the MWCS problem. The MWCS problem can be transformed into an instance of the prize-collecting Steiner tree problem (PCST), which is a well-known problem occurring frequently in operations research and networking, and various optimal and approximate solutions exist.
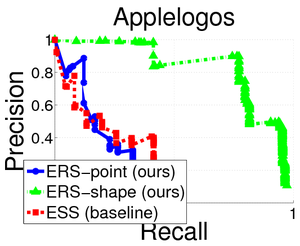
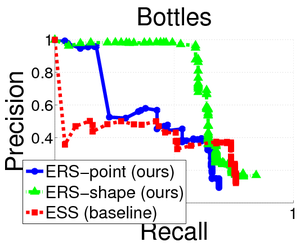
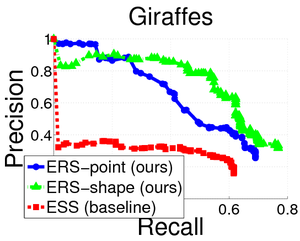
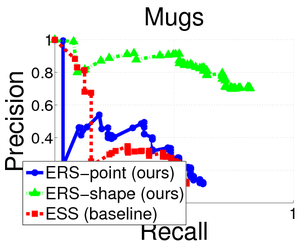
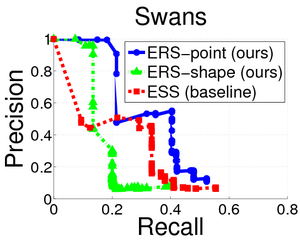
We use three datasets: the PASCAL VOC 2007, the ETHZ Shapes, and the PASCAL VOC 2008 for evaluation.
| Features | 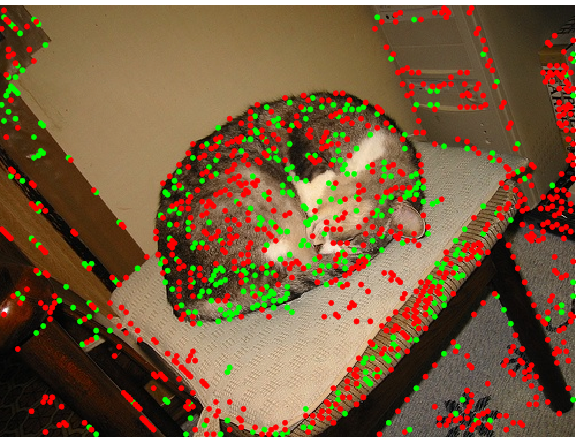 |
 |
 |
 |
 |
 |
 |
|---|---|---|---|---|---|---|---|
| ESS | 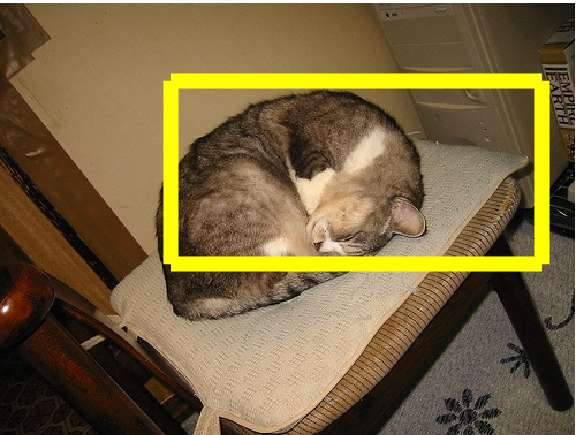 |
 |
 |
 |
 |
 |
 |
| ERS | 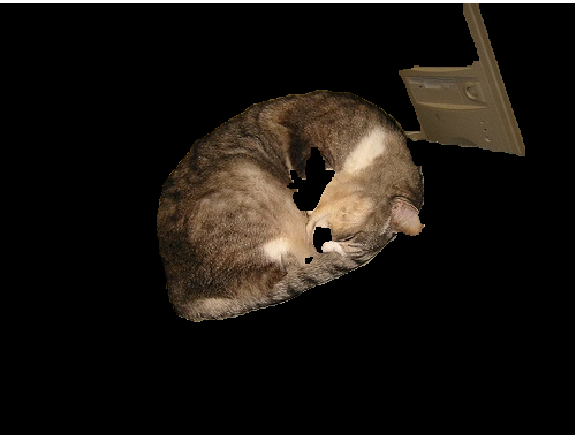 |
 |
 |
 |
 |
 |
 |
| ERS-C | 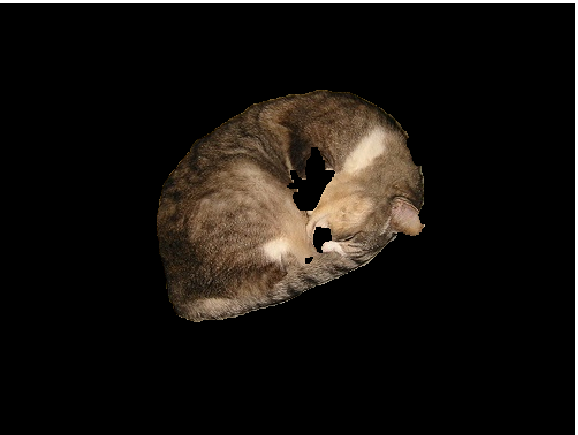 |
 |
 |
 |
 |
 |
 |
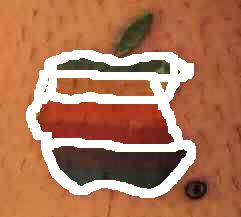
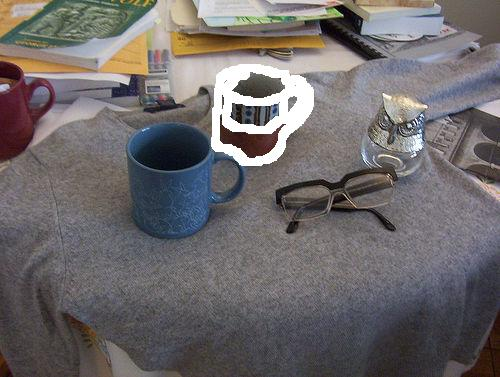
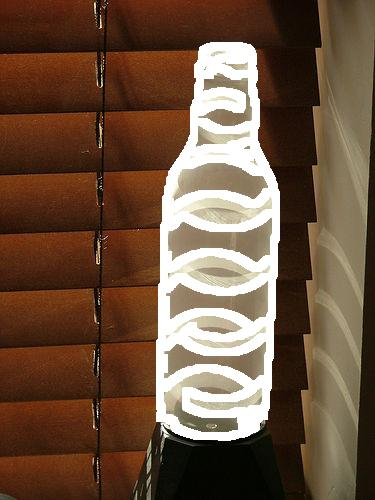
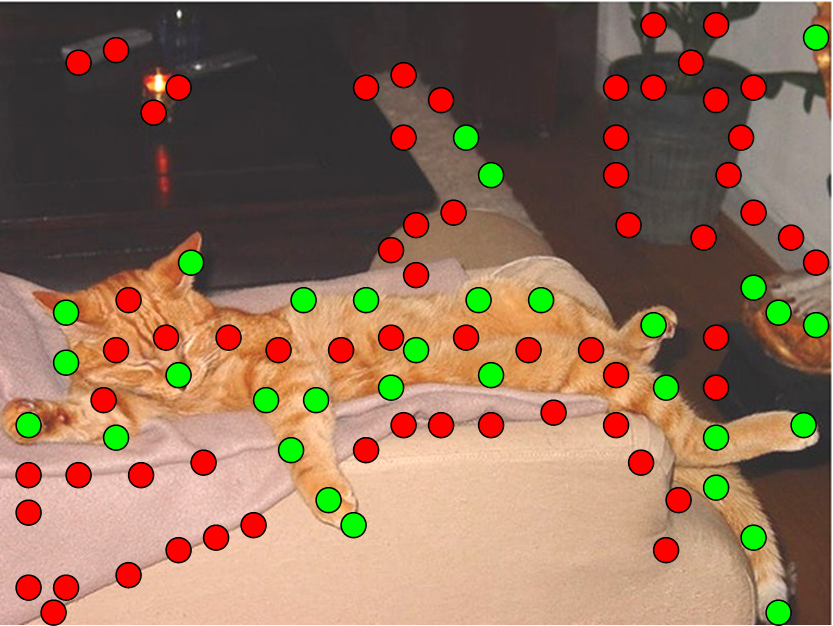
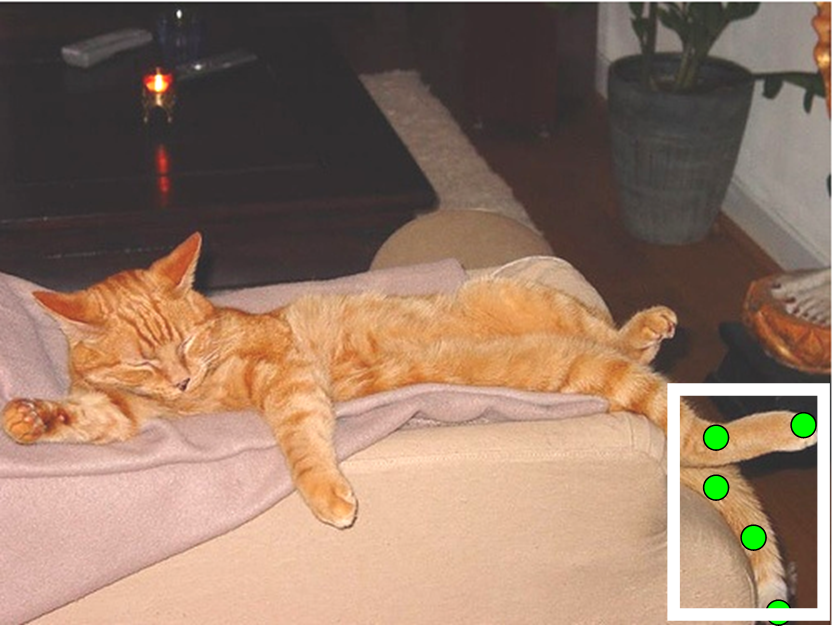
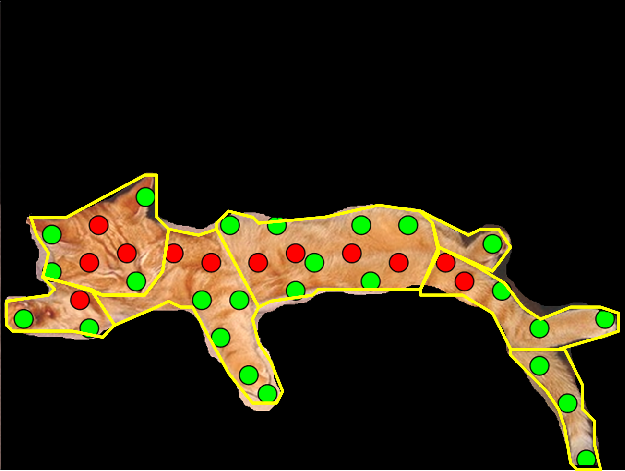
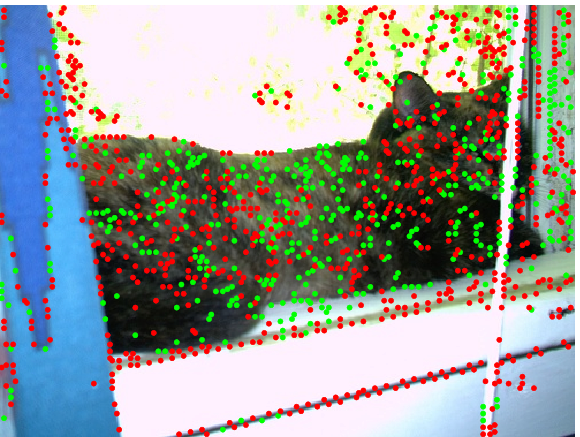
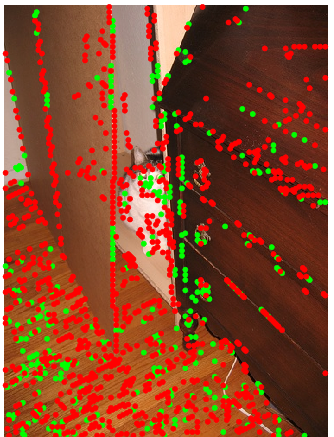
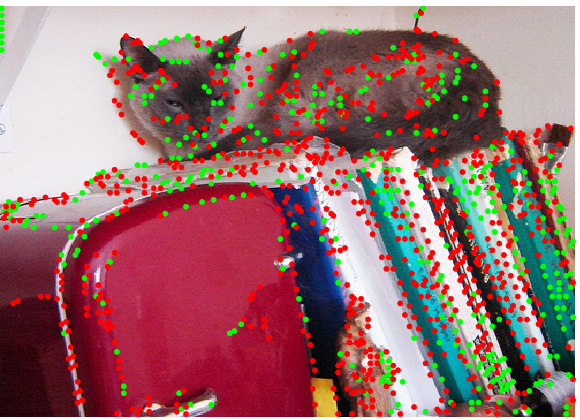
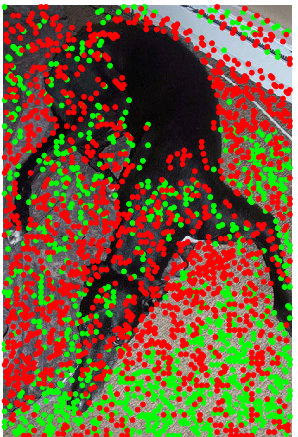
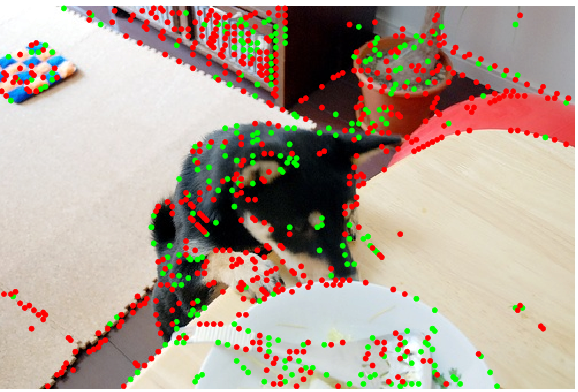
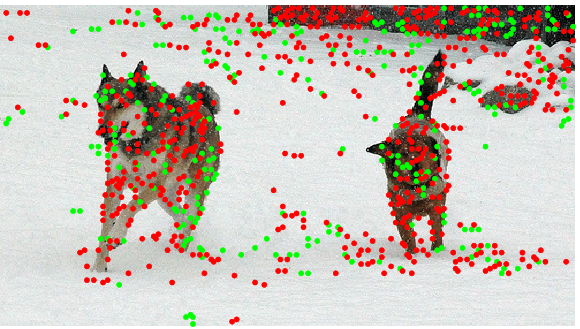
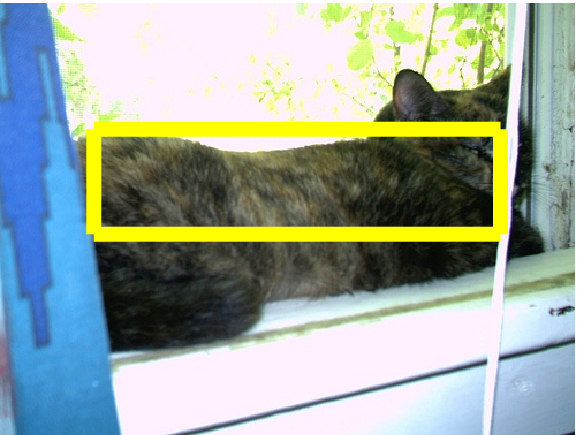
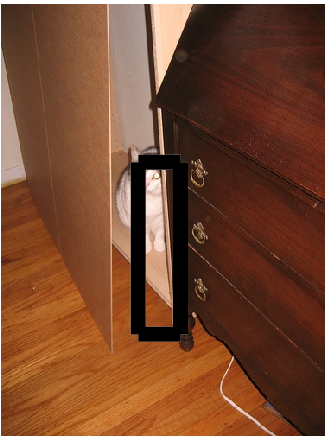
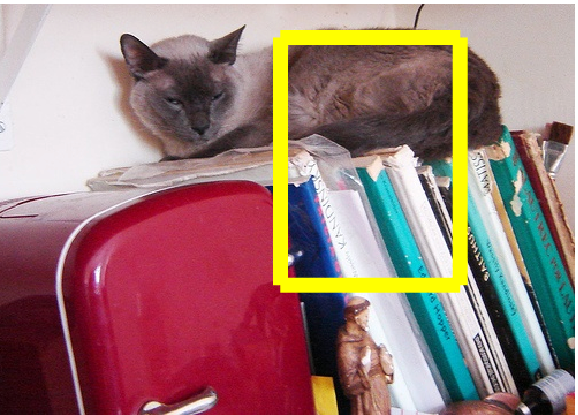
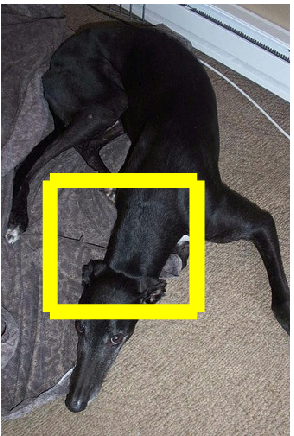
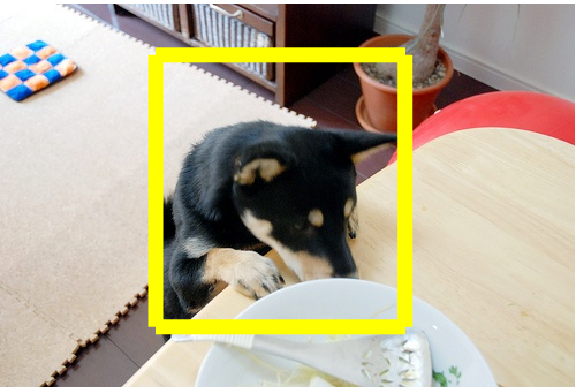
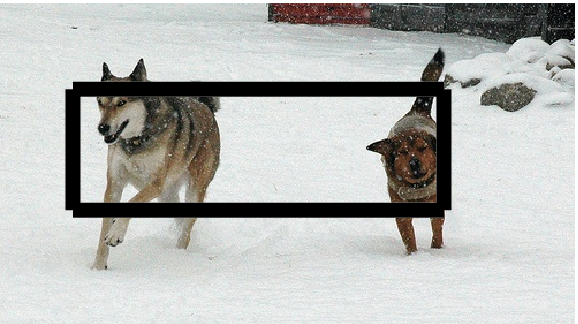
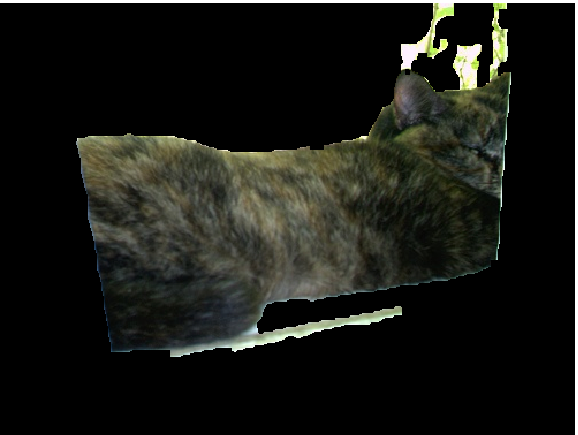
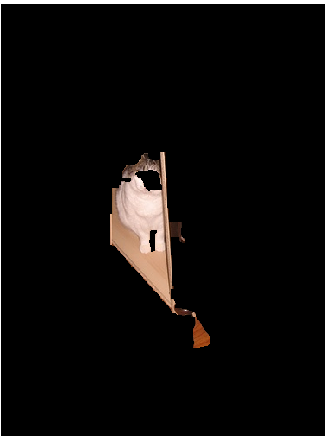
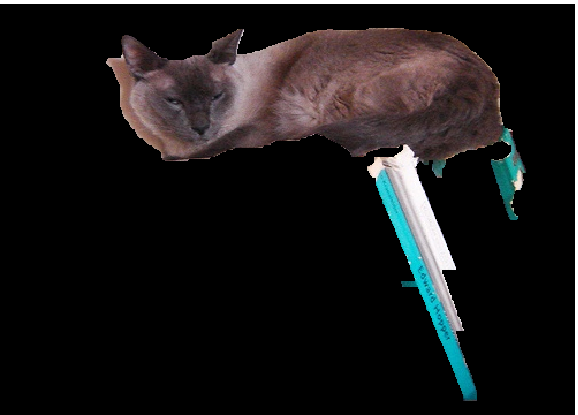
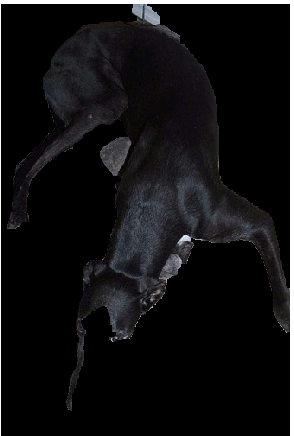
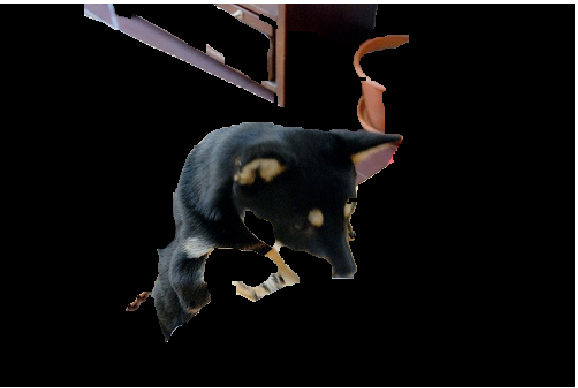
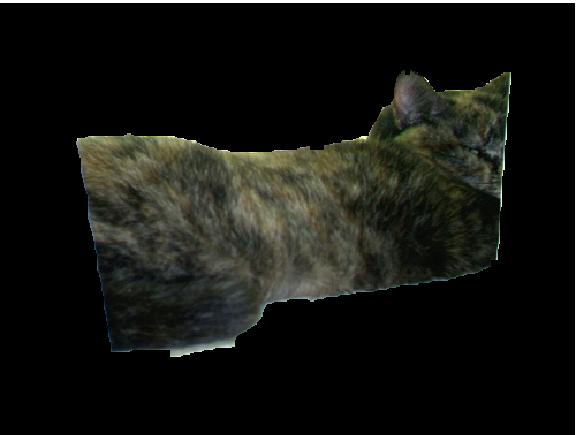
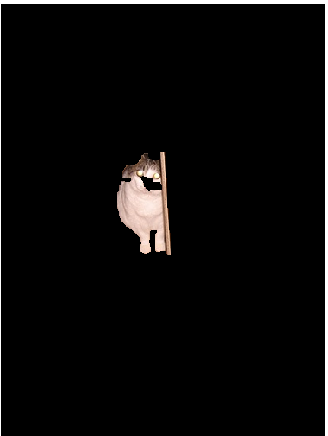
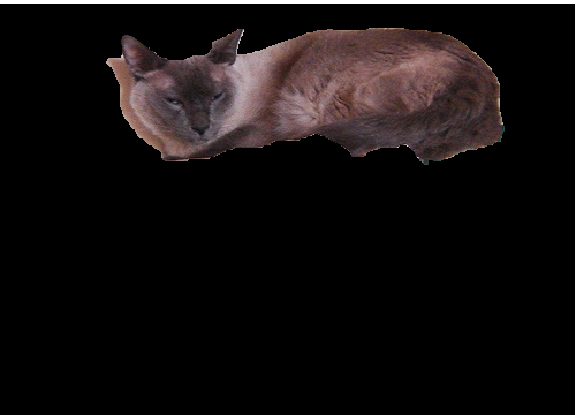
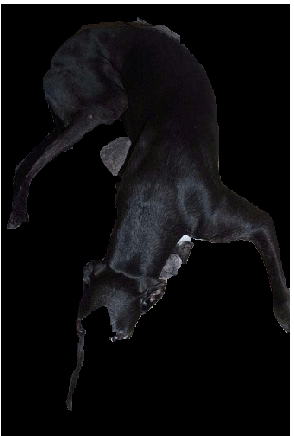
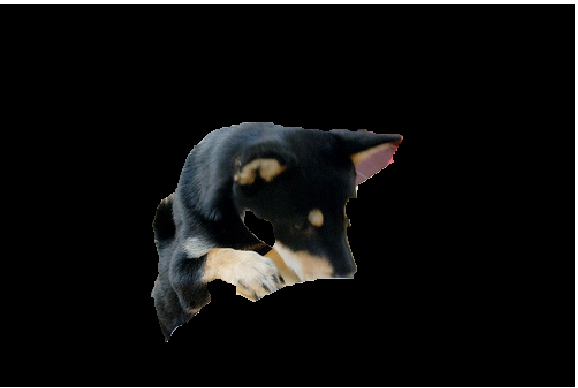
First row shows images with the sign of the point feature scores (
sign![]() ) superimposed: red dots denote negatively weighted features, green dots denote positive features (best viewed in color). Remaining rows show detections returned by ESS and ERS. Last row illustrates how ERS-C can exclude spurious background regions.
) superimposed: red dots denote negatively weighted features, green dots denote positive features (best viewed in color). Remaining rows show detections returned by ESS and ERS. Last row illustrates how ERS-C can exclude spurious background regions.
Both methods seek the region that will accumulate the most green points while avoiding including excessive red ones. However, since ESS is restricted to finding the max scoring rectangle, it often over/underestimates the object's extent. Our method provides precise arbitrarily shaped detections.
We applied our ERS method using either the point features (blue curves), or the shape features (green curves). Using shape features, we see dramatic gains for almost all objects, since the ETHZ objects have parts well-described by their shape (e.g., mug handle, bottle neck).
|
We also compare our approach against the method of [Nowozin et al 2009], which provides an approximate algorithm for using a global connectivity potential within a standard CRF.
| aerop. | bicyc. | bird | boat | bottle | bus | car | cat | chair | cow | dinin. | dog | horse | motor. | person | potte. | sheep | sofa | train | tvmon. | mean | |
| ERS | 0.324 | 0.109 | 0.268 | 0.262 | 0.121 | 0.405 | 0.244 | 0.389 | 0.120 | 0.324 | 0.300 | 0.288 | 0.280 | 0.337 | 0.257 | 0.119 | 0.394 | 0.224 | 0.453 | 0.259 | 0.274 |
| ERS-C | 0.325 | 0.058 | 0.257 | 0.262 | 0.104 | 0.405 | 0.240 | 0.399 | 0.097 | 0.319 | 0.300 | 0.249 | 0.261 | 0.280 | 0.249 | 0.107 | 0.404 | 0.210 | 0.445 | 0.272 | 0.262 |
| CRF [Nowozin et al. 2009] | 0.380 | 0.091 | 0.202 | 0.275 | 0.115 | 0.391 | 0.185 | 0.311 | 0.121 | 0.236 | 0.269 | 0.244 | 0.209 | 0.268 | 0.194 | 0.075 | 0.249 | 0.200 | 0.393 | 0.152 | 0.228 |
Our ERS approach outperforms the baseline on 17 out of 20 categories, and improves the mean overlap accuracy significantly (![]() vs.
vs. ![]() ) which indicates the value of obtaining the optimal solution with our approach as opposed to the approximate inference procedure.
) which indicates the value of obtaining the optimal solution with our approach as opposed to the approximate inference procedure.
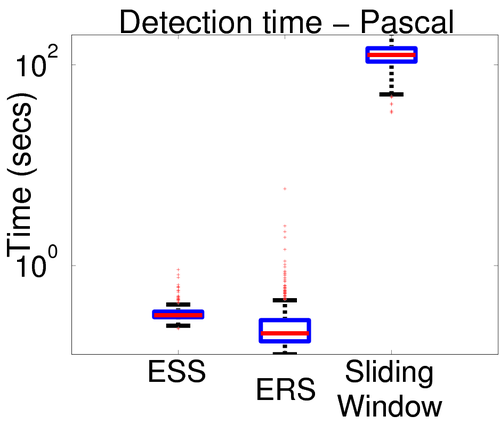
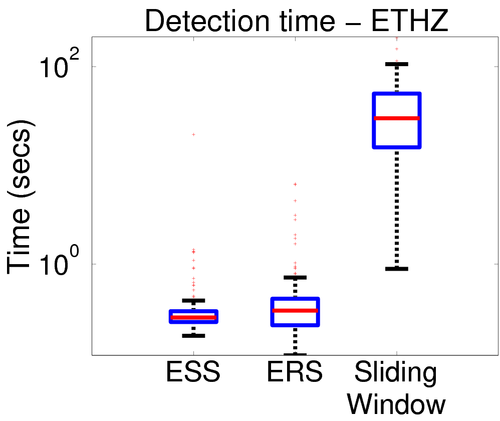
Our approach is very efficient in practice for all the datasets tested, showing the suitability of this PCST reduction for our problem setting. On average it converges in ![]() seconds, which is similar to ESS. The longest time taken over any single test image was
seconds, which is similar to ESS. The longest time taken over any single test image was ![]() secs.
secs.
 |
Efficient Region Search for Object Detection,
S. Vijayanarasimhan and K. Grauman, in CVPR 2011
[paper, code, groundtruth for cat/dog]